Quick start tutorial
This section should provide all the information needed to quickly start using mappy. If you are really in a hurry, jump to Generating the polygonal map.
Warning
We assume you already loaded the basemaps you intend to use for your mapping. If you haven’t, do it now! It will also simplify the selection of a meaningful CRS for your project. CRSs are extremely important when you are first setting up a mapping project. Have a look here for an introduction.
Initial setup
Important
You can also skip this section “Initial setup” and use the mappy algorithm Quick Mapping Project Setup to easily set up the minimum dataset needed to quick-start your mapping project. This is still a suggested reading, as it provides some useful tips!
Two different layers should be created:
A line layer (either Line or MultiLine). The associated fields are not mandatory, but you might want to consider adding a couple of fields like
certaintyand/ortypeto represent the type of contact you are tracing. Keep in mind that more information you add to your vector data, easier will be to style them later or to reuse them for other purposes.A point layer. Here we need at least one field that will be used as unique identifier for each geological unit that will be mapped. Choose for example
geo_units.
Take your time to establish the naming of your fields to be meaningful and readily understandable. The same apply for the layers. It will not influence mappy in any way, but it will help you creating a clean dataset.
The type of fields can be freely chosen, but it is highly suggested you try to
define beforehand the entries that will be used when populating your map. For
example a string/char field can be used as type for the geo-units
field, but it might be difficult to be consistent when entering those long
strings by hand (they could be easily misspelled), thus short names or a code
for each unit might be preferable.
Tip
To avoid mistakes when typing in the name of the geological unit in a string field, you could define them beforehand customizing the attribute form used to enter the field’s values. An Unique Values or a Value Map widget might be used for this task. An example will be demonstrated later.
The layers can be created in any format supported by QGIS (e.g. ESRI
Shapefiles), but we suggest organizing your work within
a geopackage file. This
open format make it possible to store within a single and portable file any
number of different vector layers. To create a new geopackage
use Layer ► Create Layer ► New Geopackage Layer or CTRL+SHIFT+N.

Fig. 1 Creating a new geopackage layer in QGIS with one point layer named points
, with one field geo_unitsof type Text Data. Once the geopackage is
created new layers can be appended to the same file by selecting the
same Database geopackage. The same operation should be performed for
creating the line layer that will contain the contacts.
Warning
Remember to set a meaningful CRS for the layer. It might be worth taking some time to verify the CRSs that are used in the basemaps you will be using for your mapping and chose among those the most suitable. If you have loaded your basemap at the beginning as suggested you might just need to select the “Project CRS” from the options.
Drawing the contacts
Assuming you have already loaded your basemaps you can now start tracing your contacts. Just enable the editing (use Toggle Editing from right-clicking on the layer) for your newly created layer and add new lines. Something very important that you should keep in mind is that you should not be focusing on the outline of each unit, but rather determine the contacts between the different units.
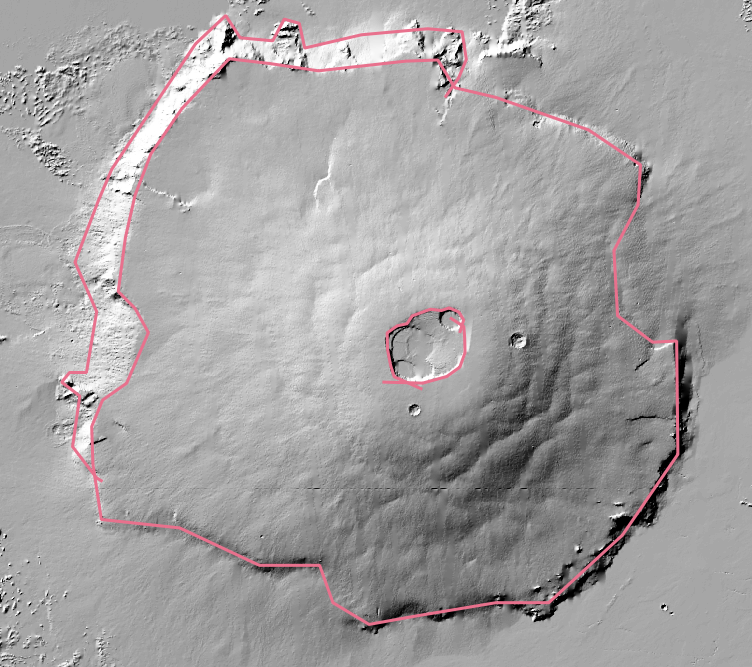
Fig. 2 Example of linework on the Olympus Mons volcanic edifice on Mars, we used the lines to define the contacts between different morphological units. Notice that the linework does not need to be precise (here exaggerated), we just need the line to be intersecting to correctly define the units. Also multiple lines can be used to define one contact, provided they all intersect each other (see the calderas on the summit).
Defining indicator points
Tip
Mappy will generate indicator points for any unlabeled unit by default. But you will still need to provide a point layer to be used for labelling the units.
The next step consist in labelling each region we have identified with the contacts. To do so a point layer will be used: a new point will be placed anywhere within the given unit and its fields will be populated accordingly.
We will use the following unit’s shortcuts:
Code |
Legend |
|---|---|
SCA |
Outer escarpment of the volcano |
EDF |
Main shield volcanic edifice |
SC |
Summit calderas |
and populate the points layer. If you want you can setup dedicated field widget to ease this work ( Right Click on Layer ► Properties ► Attributes Forms).

Fig. 3 Example of attribute form set up with the predefined unit’s names (notice you can also create them as a CSV file to load).
After enabling the point layer for editing we add new points by left-clicking with the mouse in the location of interest. You must activate the adequate tool for adding new points (look for Add Point Feature button or use CTRL+.). For each unit you will need to enter the corresponding unit. If you set up a dedicated Attribute form the dialog will look something like this:

Fig. 4 Example of Feature Attribute Dialog, customized with a Value Map field widget. It ensures no wrong codes can can be inserted into the database.
After adding all the needed points the results should be something like this:

Fig. 5 Example of points used to define the names of the units. Short-codes were used to uniquely identify the unit. To show the labels follow Right-Click on layer ► Properties ► Labels and configure accordingly.
Remember to save the layers by using the Save Layer Edit in the Digitizing toolbar.
Generating the polygonal map
Mappy can be accessed through a dedicated toolbar:

The gear button will toggle the configuration dialog:

Fig. 6 Mappy settings dialog
The second button (Recompute Map) is used to quickly recompute the map on the basis of the configuration provided in the main dialog. It is meant to be the only button that you are going to use every time you need to refresh the polygons during the mapping.
The config dialog requires you to set:
Input
Line-geometry layer: it will be used as source of your contacts, any line layer will work (you can organize the fields of your contacts freely).
Point-geometry layer: it will be used to label the newly generated polygons, and it must have at least one field that will be used as unit’s name.
Unit’s field is the field of the points layer that is used by mappy. Although mappy transfer all the existing fields to the polygons the field is still needed so that mappy knows what field to use for generating the legend/colors.
Output
Output Geopackage: The geopackage in which the output layers will be written
Polygons layer: the name that will be used in the output geopackage to name the polygonal layer
Clean Contacts layer name: (if enabled) the name for the clean contacts layer in the output geopackage
If clean contacts generation is enabled mappy will generate a copy of your input contacts after cleaning them from dangling ends. This layer is intended to be used as overlay for your final layout
Warning
The operation of dangling-ends removal that is used to generate the Clean Contacts layer is computationally intensive in the present implementation. If you experience qgis unresponsiveness during the map computation try to disable this feature and use it only at the end for finalizing the map.
Options
Overwrite Output Layer: it will take the freedom to overwrite the output polygonal layer if it is already present
Auto-add Missing Indicator Points: it will automatically compute and add any missing indicator point. You will then still need to populate the fields to label your units.
Copy Line Style: it will copy the styling of your contacts to your Clean Contacts layer (if generated). In this way you can work with correctly styled layers and have the style copied to final version of your contacts.
After setting and double-checking your config you can now press the Recompute Map toolbar button and have your polygons computed.
Styling the map
Warning
Mappy will take care of styling the polygons for you, it will also copy the
style of you contacts layer to the Clean Contacts layer. Anyway if you need to
style them by hand here are some instructions.
The map can then be styled with Right-click on Layer ► Properties ► Symbology. A Categorized symbology might be used, like so (you can use the Classify button to automatically add all your unit’s definitions, also remember to modify the Legend items if you want a full description of the map in the printing layout):

Tip
Notice you might want to set the Stroke Stile to No Pen for the polygonal layer, so that only the line contacts will be visible in the final map.
your map might look like this:

Fig. 7 Polygonal map with styling.
Tip
To enable this kind of transparency find the Blending Mode option under the layer’s Symbology ► Layer Rendering dialog, and set it to Overlay